


 281 / 413

6/11
Diagnostics integrated in Modicon M340, Premium and Quantum automation platforms
Presentation
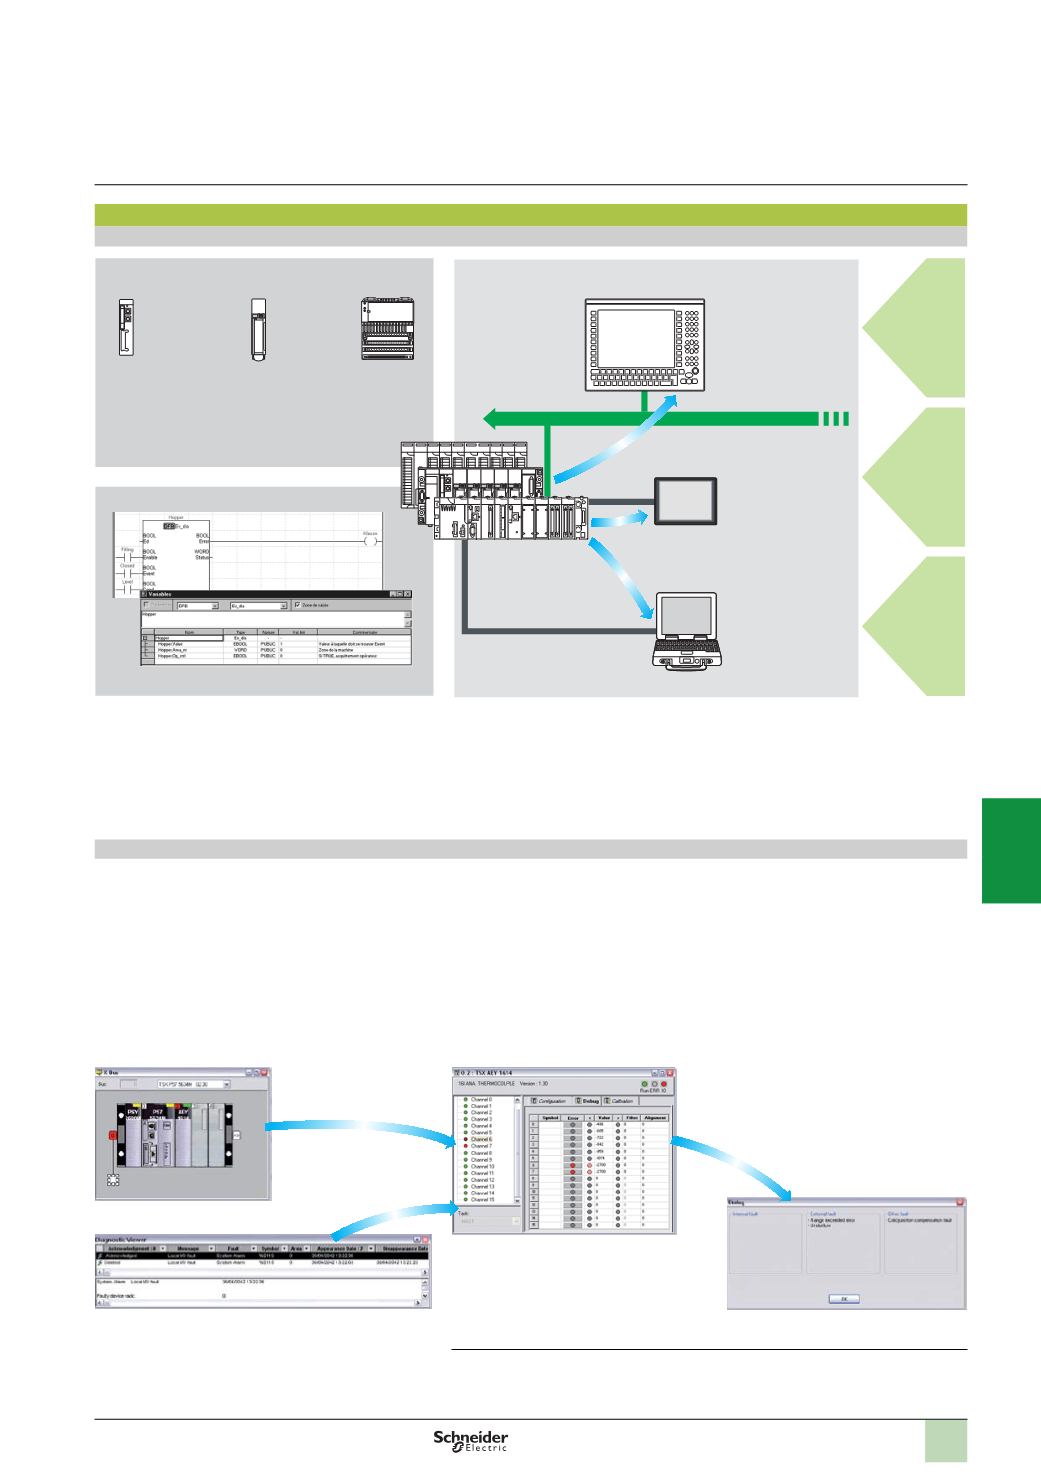
The diagnostics offer for Modicon M340, Premium and Quantum platforms is based
on the following three components:
b
System diagnostics
b
DFB and EFB diagnostic function blocks (for system and application diagnostics)
b
Error message display system, called viewers, supplied as a standard component
of Magelis XBT terminals, Vijeo Citect supervisory software and Unity Pro setup
software
System diagnostics
The system diagnostics for the Modicon M340, Premium and Quantum platforms
support the monitoring of system bits/words, I/O modules and activity times (minimum/
maximum) of SFC steps. By simply choosing the relevant option during application
configuration, any event will generate time-stamped messages logged in the diagnostic
buffer of the PLC.
These events are displayed automatically in a diagnostics viewer
(1)
without requiring
any additional programming.
With Unity Pro integrated diagnostics, this function can be used to perform first level
diagnostics of the elements in the configuration, up to and including each I/O module
channel.
Configuration level
Viewer window (example with Unity Pro software)
Module level
Channel level
(1)
Diagnostics viewers are tools for displaying and acknowledging diagnostic error messages.
They are supplied as a standard component of Unity Pro and Vijeo Designer software, with
Magelis terminals and with the PLC Web server that can be accessed via a thin client Magelis
i
PC.
Processor for
system bits
and words
In-rack I/O
modules
Remote I/O
modules on
Fipio or
CANopen
Higher-level
M.E.S.
Cell level
Machine level
Unity Pro
Diagnostics viewers
System diagnostics
Application diagnostics
Ethernet TCP/IP
Magelis XBT
PC
Vijeo Citect
Thin client Magelis iPC
Quantum,
Premium,
Modicon M340
Vijeo Designer
Software
Unity Pro software
Small/Medium/Large/Extra Large
Integrated diagnostics
Functions
(
continued)
2
1
3
4
5
6
7
8
9
10