
93
n
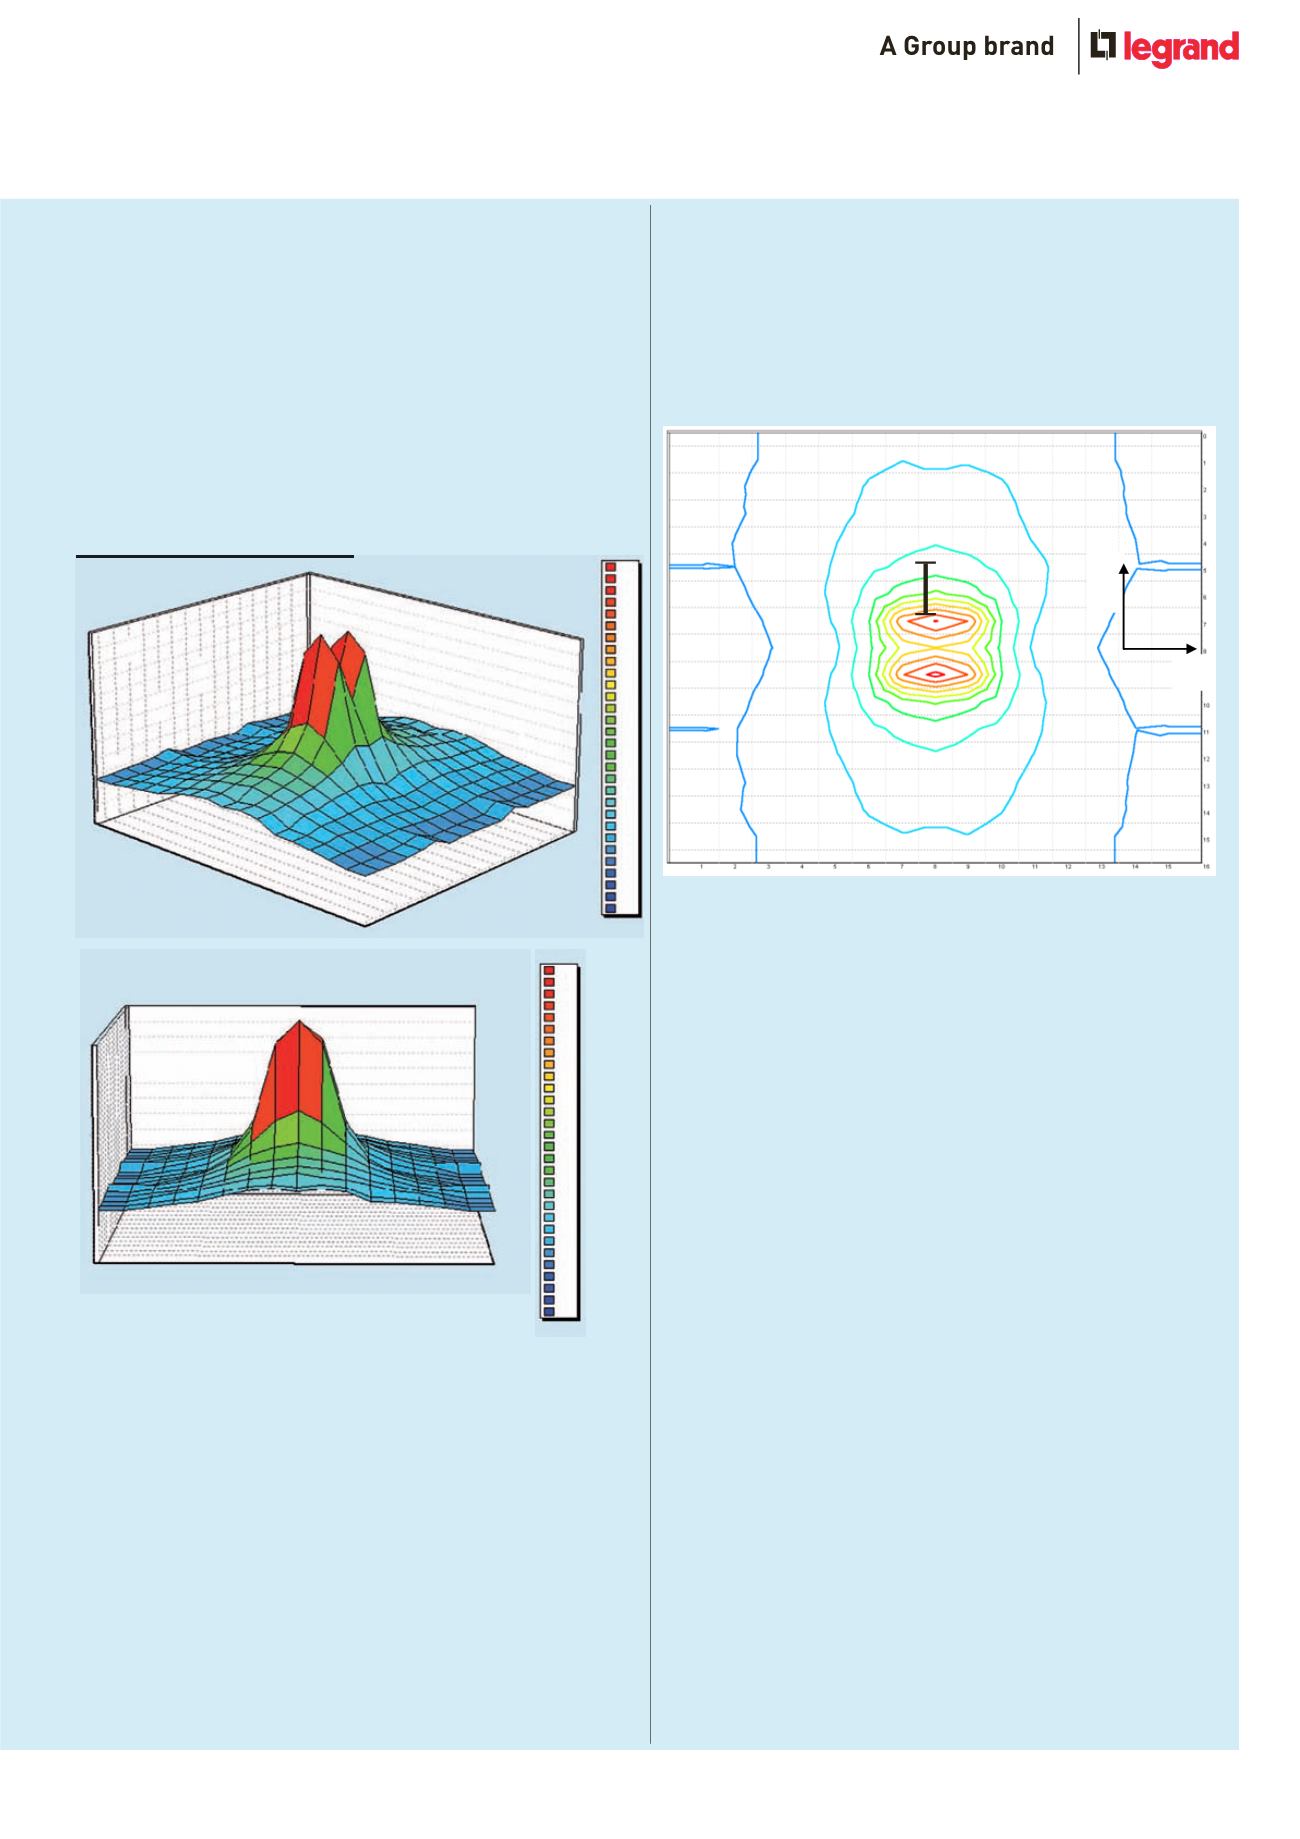
Magnetic induction graphs at 60 cm from the busbar
The graphs shown refer to the measurements carried out on the
aluminium SCP prefabricated electric busbar with rated load of 2500 A,
crossed by a 2 500 A current
The measurements carried out at 60 cm from the junction are to be
considered as higher due to the magnetic induction generated by the
busbar power supply :
due to the intrinsic geometry of the measurement laboratory structure,
it must be assumed that the measurement area is also affected by a
magnetic induction of no less than 1·5 μT generated by the line power
supply
In view of this observation, in case of actual operating line the quality
objective indicated by Legislative Decree DPCM dated 8/7/2003 is
widely met at less than one metre from the axis of the busbar
All dimensions (mm) are nominal
3 dimensional development of magnetic induction around the
busbar at 60 cm from the junction
2 dimensional map of the magnetic induction around the busbar
at 60 cm from the junction
At the centre of the graphic is a schematic representation of the
busbar
x
y
The cells making up the measurement grid are 20 cm squares
n
Magnetic induction graphs at 60 cm from the busbar
(continued)
As it can be seen on the graph below, up to a distance of approximately
40 cm from the axis of the busbar, the field appears generated by two
separate sources. This is due to the fact that the busbar being analysed
consists of two series of busbar conductors set in parallel at a distance
of approximately 5 cm from each other
12
11
10
9
8
7
6
5
4
3
2
1
0
12
11·6
11·2
10·8
10·4
10
9·6
9·2
8·8
8·4
8
7·6
7·2
6·8
6·4
6
5·6
5·2
4·8
4·4
4
3·6
3·2
2·8
2·4
2
1·6
1·2
0·8
0·4
0
123456789
10 11 12 13 14 15 16
12
11·6
11·2
10·8
10·4
10
9·6
9·2
8·8
8·4
8
7·6
7·2
6·8
6·4
6
5·6
5·2
4·8
4·4
4
3·6
3·2
2·8
2·4
2
1·6
1·2
0·8
0·4
12
11
10
9
8
7
6
5
4
3
2
1
0
16
15 1413 12
11 10
98


