
SCP
super compact busbar
technical information
94
n
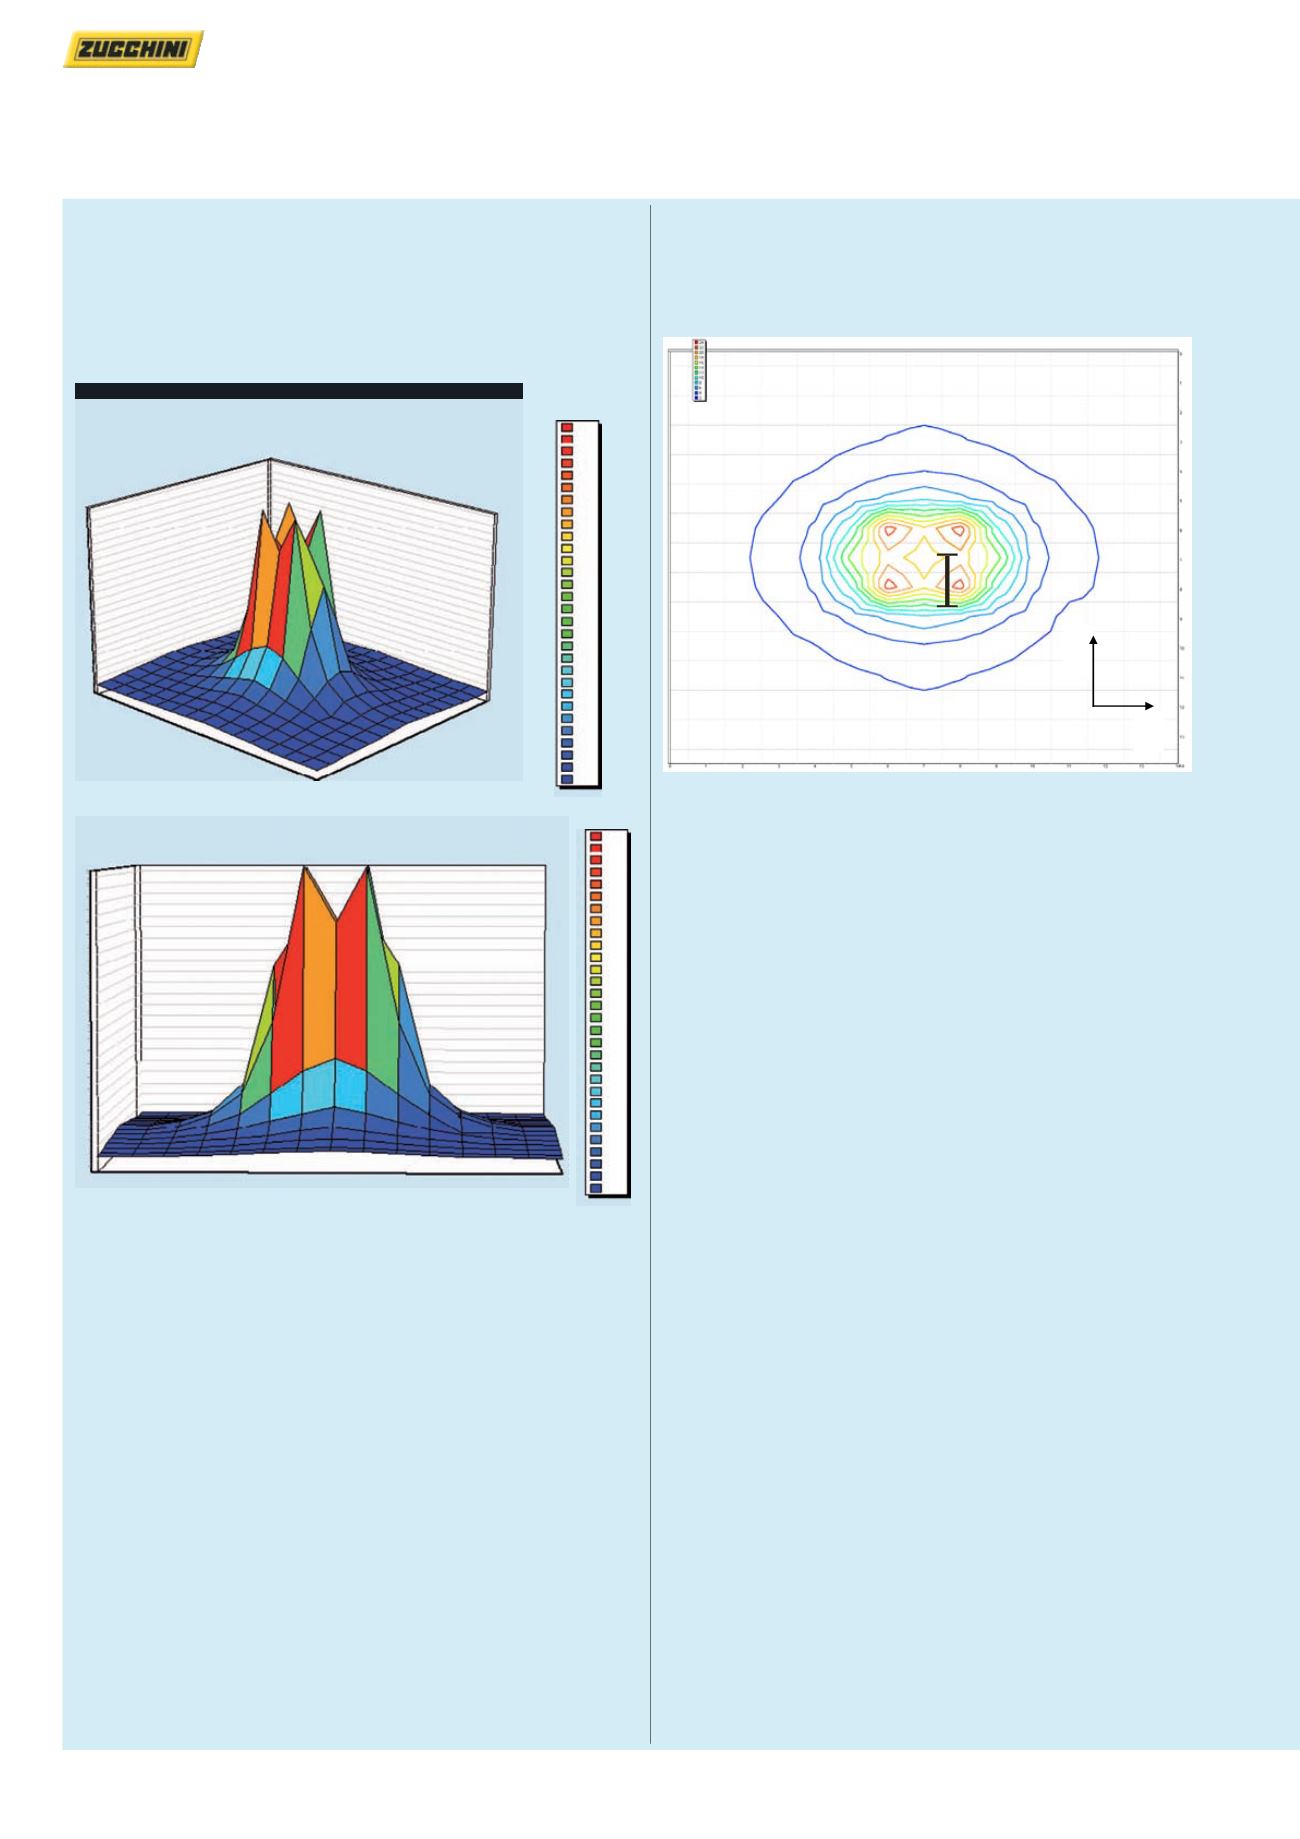
Graphs showing magnetic induction near the junction
It is considered important to show, side by side with the results relating
to straight lengths, the results of the measurement carried nearby the
electro-mechanic junction of the busbar length. This location may in fact
be considered critical, as here magnetic induction is higher due to the
higher distance between the busbar conductors corresponding to the
various phases of the line
All dimensions (mm) are nominal
Tridimensional development of magnetic induction near the joint
2 dimensional map of magnetic induction near the junction
At the centre of the graphic is a schematic representation of the
busbar
x
y
24
23·2
22·4
21·6
20·8
20
19·2
18·4
17·6
16·8
16
15·2
14·4
13·6
12·8
12
11·2
10·4
9·6
8·8
8
7·2
6·4
5·6
4·8
4
3·2
2·4
1·6
0·8
23
22
21
20
19
18
17
16
15
14
13
12
11
109876543210
24
23·2
22·4
21·6
20·8
20
19·2
18·4
17·6
16·8
16
15·2
14·4
13·6
12·8
12
11·2
10·4
9·6
8·8
8
7·2
6·4
5·6
4·8
4
3·2
2·4
1·6
0·8
23
22
21
20
19
18
17
16
15
14
13
12
11
10
9
8
7
6
5
4
3
2
1
0
n
Graphs showing magnetic induction near the junction
(continued)


