


 5 / 38

10
Busbar Systems
General data
10/5
Siemens LV 10 · 2014
■
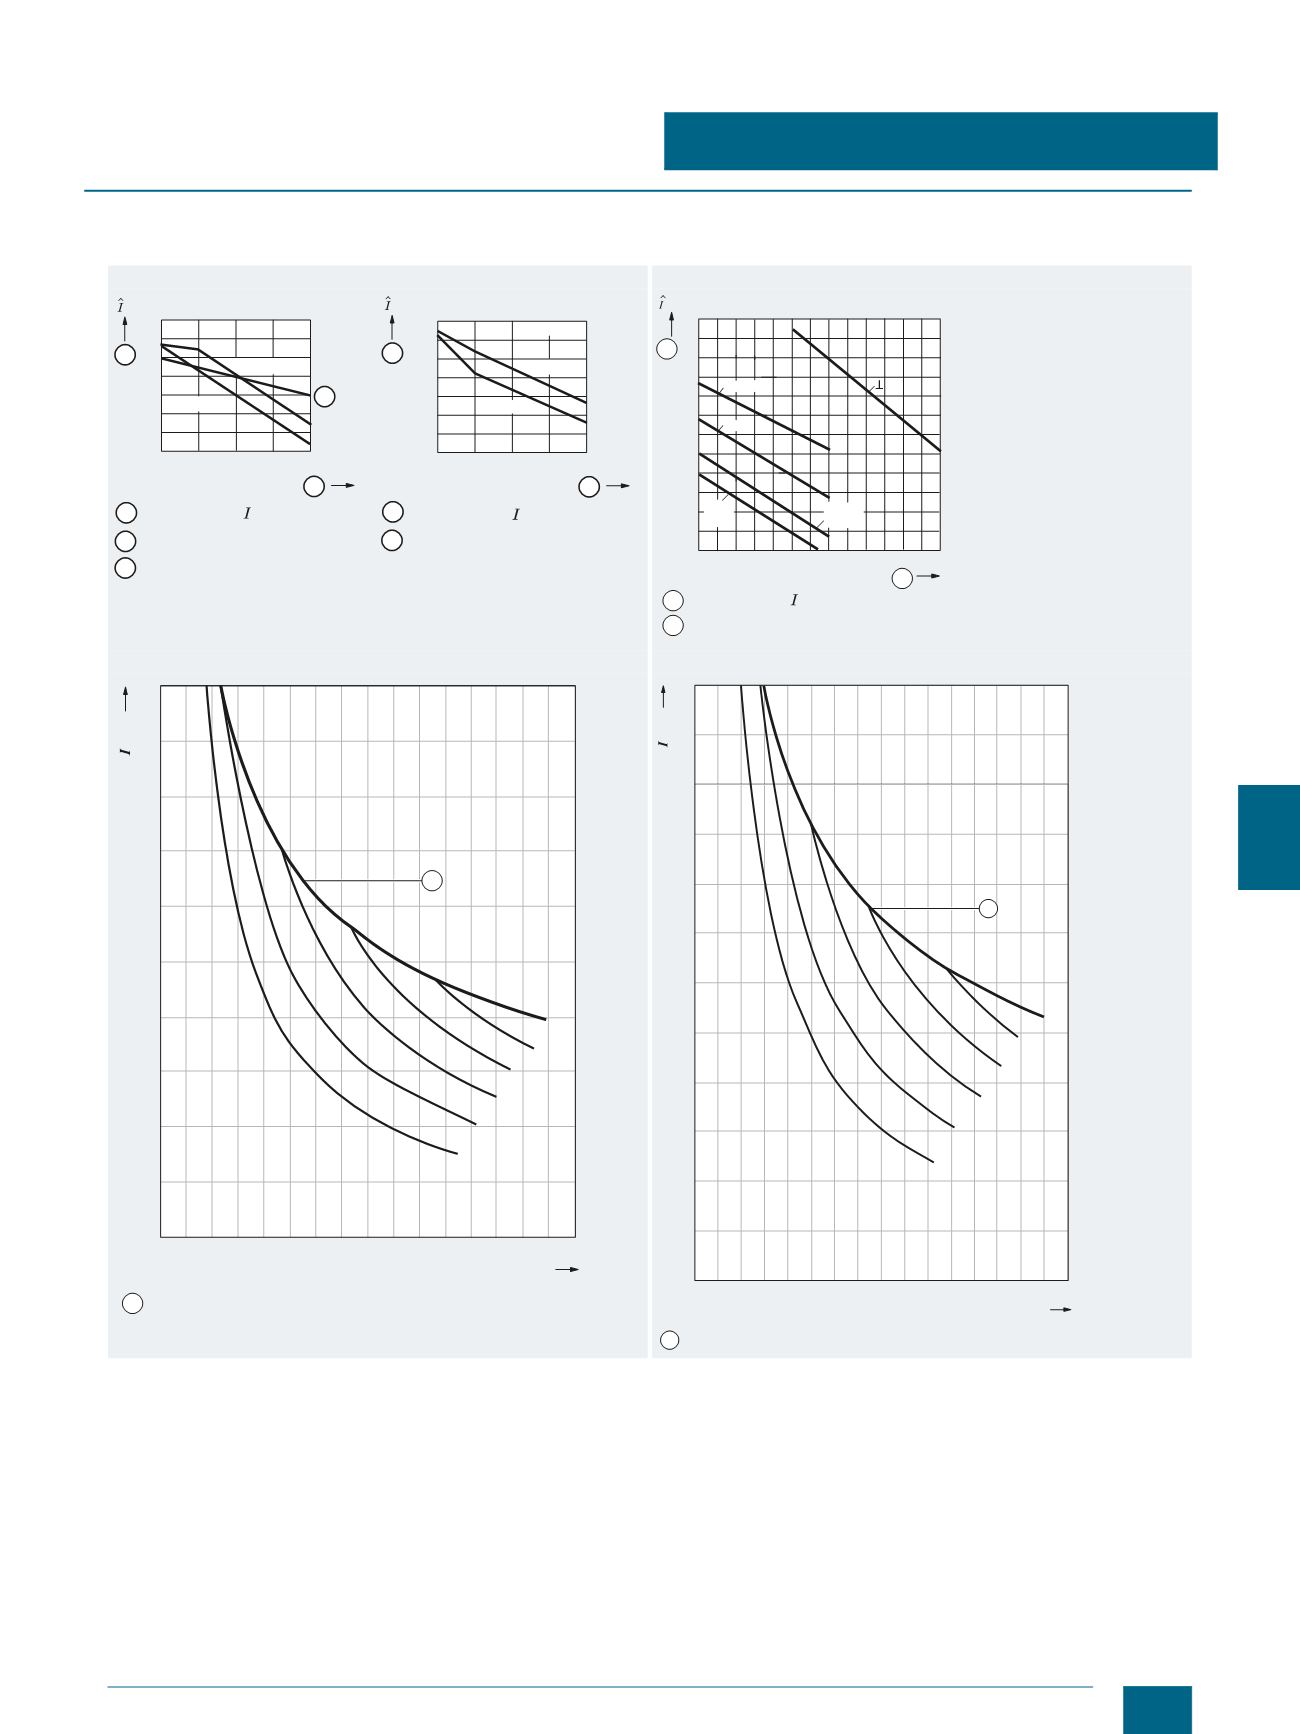
Characteristic curves
Characteristic curves as a function of rated peak withstand current
40 mm busbar systems
60 mm busbar systems
100 mm busbar systems
185 mm busbar systems
1
1
2
3
3
2
Surge current
pk
Spacing of busbar supports
5-pole busbar supports
mm
kA
pk
NSE0_01546
55
50
45
40
35
30
25
20
200
1 x 12x5
2 x 12x5
300
250
350 400
1
2
2
1
Surge current
pk
Spacing of busbar supports
kA
55
50
45
40
35
30
25
20
mm
200
300
250
350 400
pk
NSE0_01547
1 x 15x5
2 x 15x5
pk
NSE0_00342b
90
kA
80
75
70
65
60
55
50
45
40
35
30
600
500
400
300
mm
700 800 900
20x10
12x10
20x5
12x5
30x10
30x5
T
1
1
2
2
Surge current
pk
Spacing of busbar supports
I201_18591
100
90
80
70
60
50
40
30
20
10
10 20 30 40 50 60 70 80 90 100 110 120 130 140 150 160
30x10
30x10
40x10
50x10
60x10
80x10/100x10
1
1
Busbar support distance a cm
Maximum lead on busbar system
Maximum asymmetric short-circuit-current
s
kA
I201_18592
100
110
120
90
80
70
60
50
40
30
20
10
10 20 30 40 50 60 70 80 90 100 110 120 130 140 150 160
30x10
30x10
40x10
50x10
60x10
80x10/100x10
1
1
Busbar support distance a cm
Maximum lead on busbar system
Maximum asymmetric short-circuit-current
s
kA
© Siemens AG 2014