


 146 / 381

4.43
Sales Service Centre • 01952 675612 Technical Support Helpline • 01952 675689
MCCBs, Moulded Case Switches
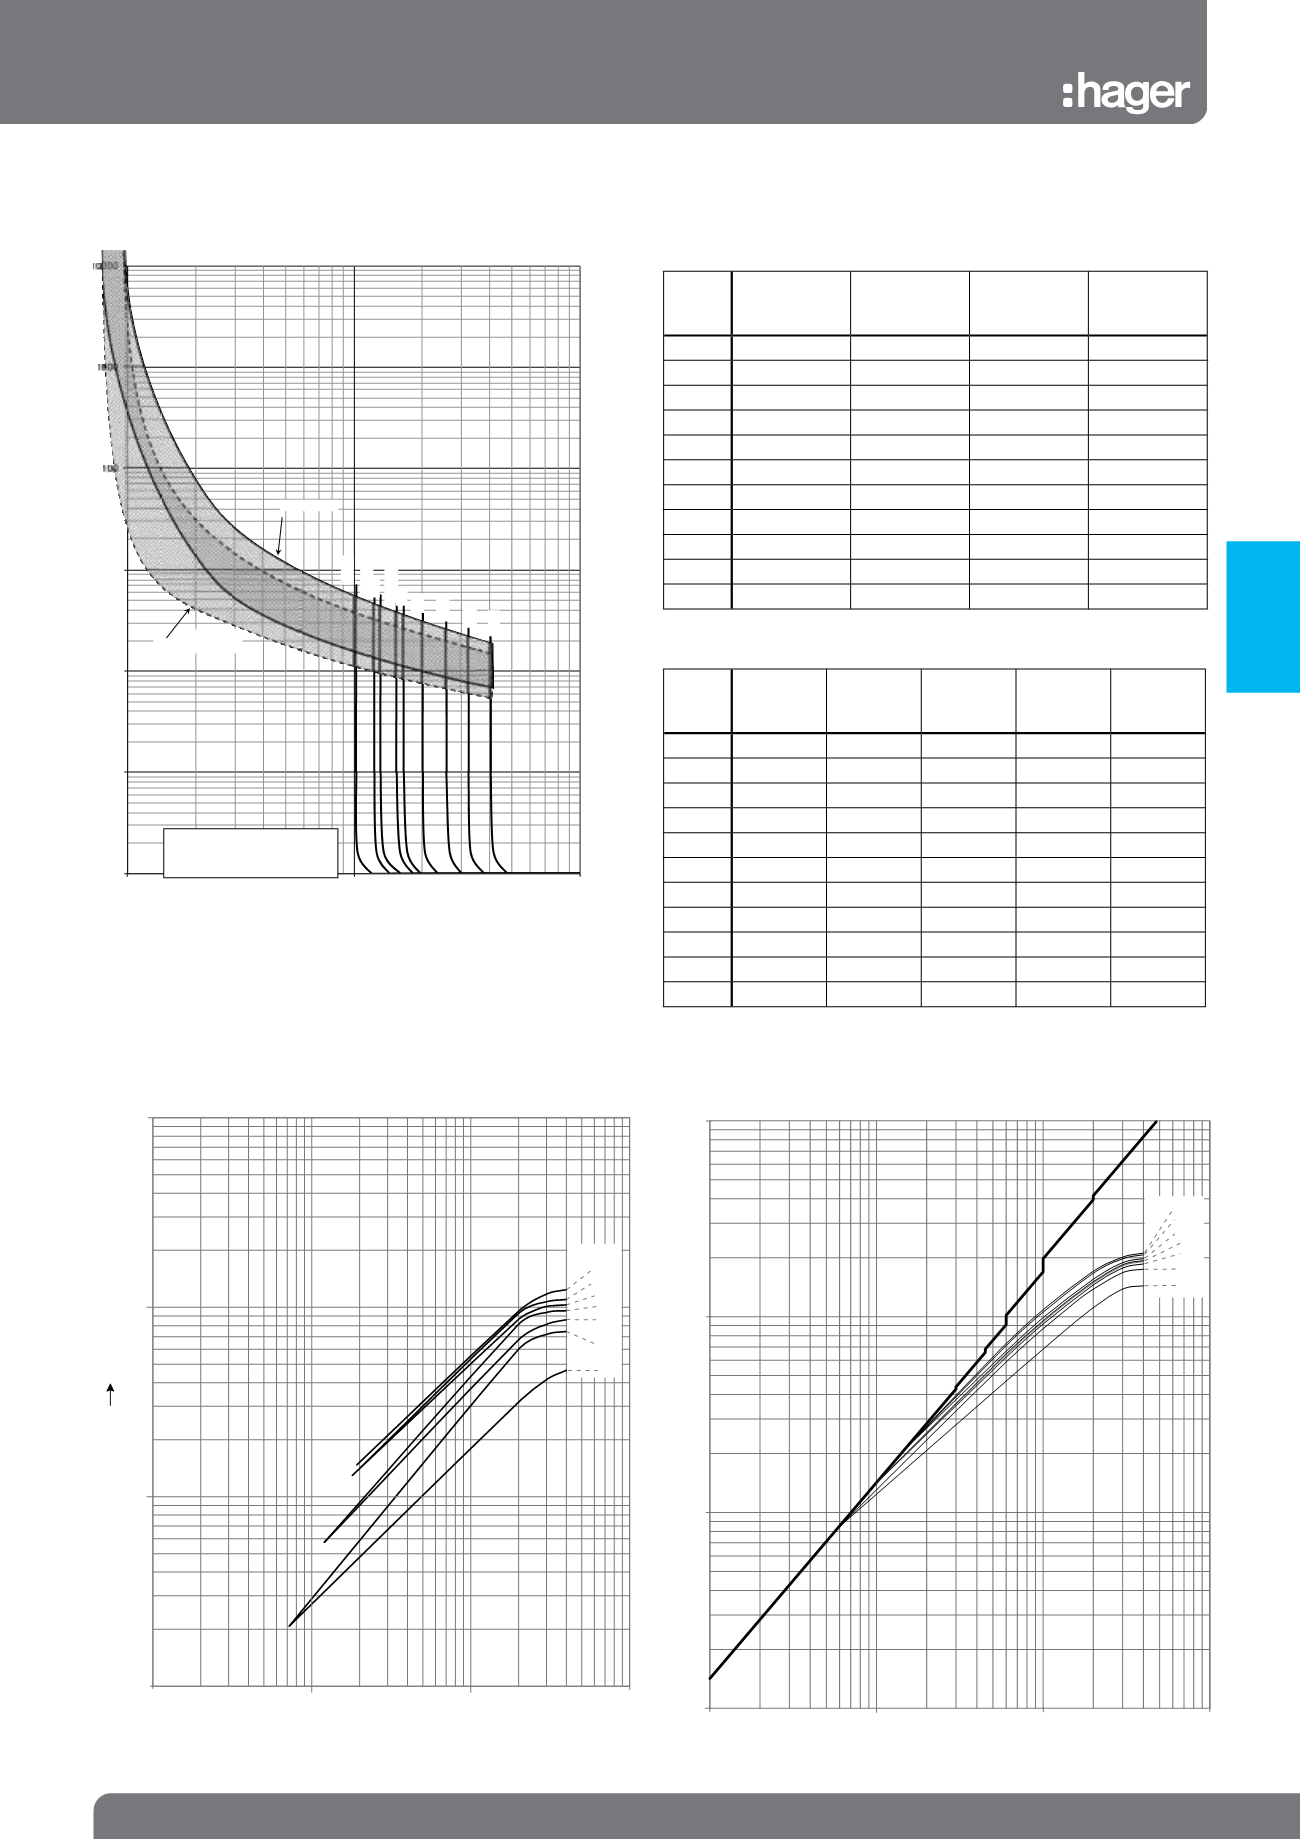
x160
Tripping curve
MCCB x160
MCCB Disconnection Data
Thermal constraint curve at 400V (Let-through energy)
MCCB x160
Current limiting curve at 400V (Let-through peak current)
MCCB x160
16A
40A
63A
80A
100A
125A
160A
I
2
t (A s)
2
10
4
10
5
10
6
10
7
10
1
10
2
1
0.1
IPF (kA rms)
125A
0.8
0.5
0.3
0.25
0.7
0.9
16A
40A
63A80A 100A
160A
0.1
1
10
100
10
10
1
0.1
IPF (kA rms)
Ip (kA)
1
2
0.01
0.1
1
10
1
10
100
Tripping time (sec)
x In @ Tcal (A)
From cold state
From warm state
(rated current)
The magnetic thereshold
tripping curves is mean value. The
tripping area is Irm ±20%.
160A
80A
100A, 40A
63A
32A
25A
20A
16A
125A, 50A
Earth Fault Loop Impedance Data
Disconnection time 0.2s, 0.4s, 1s
Device
rating
(A)
Instantane-
ous trip (xIn)
Instantane-
ous trip (A)
add 20%
tolerance (Ia)
Zs = 230 / Ia
16
40.3
644.8
773.8
0.30
20
32.2
644.0
772.8
0.30
25
25.7
642.5
771.0
0.30
32
20.1
644.2
773.0
0.30
40
15.0
600.0
720.0
0.32
50
12.0
600.0
720.0
0.32
63
16.6
1045.8
1255.0
0.18
80
13.1
1048.0
1257.6
0.18
100 15.4
1540.0
1848.0
0.12
126 12.3
1537.5
1845.0
0.12
160 10.2
1635.2
1962.2
0.12
Disconnection time 5s
Device
rating
(A)
trip (xIn)
Mag/Ther-
mal
Ia (A)
Ia (+20%
if mag)
Zs = 230
/ Ia
16
15.4
T
246.4
N/A
0.93
20
15.4
T
308.0
N/A
0.75
25
15.4
T
385.0
N/A
0.60
32
15.4
T
492.8
N/A
0.47
40
15.0
M
600.0
720.0
0.32
50
12.0
M
600.0
720.0
0.32
63
15.4
T
970.2
N/A
0.24
80
13.1
M
1048.0 1257.6 0.18
100 15.4
M
1540.0 1848.0 0.12
126 12.3
M
1537.5 1845.0 0.12
160 10.2
M
1635.2 1962.2 0.12
Protection
Devices