


 488 / 582

BETA Monitoring
Monitoring of Electrical Values
7
LQ3 insulation monitors for medical premises
13/32
Siemens ET B1 · 10/2008
13
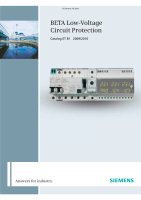
Voltage relays
Use L
a
und L
b
for monitoring 2 phases or 2-channel monitoring
of 1 phase. If only L
a
is used, L
b
must be bridged with L
a
.
■
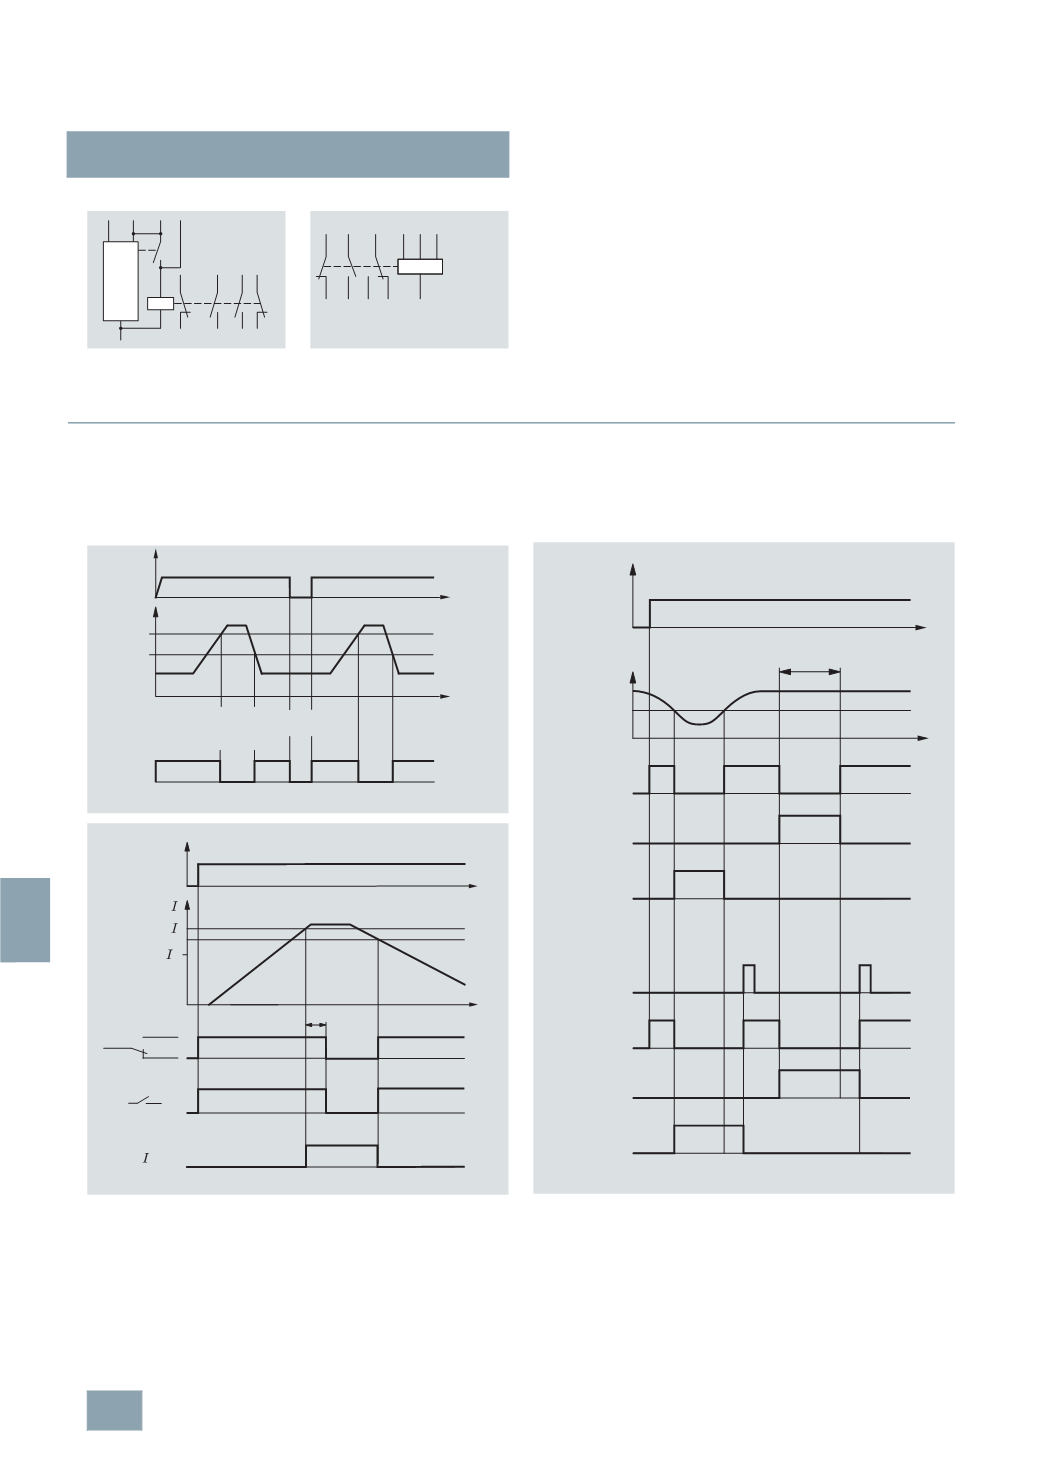
Characteristic curves
7
LQ3 354 and 7LQ3 355 insulation monitors
The following diagrams show the function of the measuring
circuits of the temperature monitors (top left), the load current
monitors (bottom left) and the insulation monitors (right).
5
TT3 411
5
TT3 412
I2_13714
N
L
b
Y1 Y2
L
a
11
12
23
24
33
34
41
42
I2_13715a
L1 L2
N
L3 11 23 31
14 12
24 32
t
t
I2_13579
11-14
21-24
11-12
21-22
V
U
R
P1/P2
≥ 3,2 kΩ
≤ 1,8 kΩ
Over-
temperature/
sensor break
Power
failure
I2_13580
V
U
>
N
31/41
34/44
32/42
t
t
t
v
>
LED
green
On
Off
LED
red
On
Off
Hysteresis
I2_13581
V
U
F
R
51-54
61-64
51-52
61-62
51-54
61-64
51-52
61-62
an
R
t
t
Break
Measuring circuit
Without fault storage
(
jumper LT1-LT2)
With fault storage
(
without jumper LT1-LT2)
LED “MK“
On
Off
LED “AL“
Reset push-
button LT
On
Off
LED “MK“
On
Off
LED “AL“
On
Off
Ground fault
© Siemens AG 2008