


 423 / 582

BETA Measuring
Three-Phase Measuring Devices
7
KT1 30 multimeters
11/7
Siemens ET B1 · 10/2008
11
■
More information
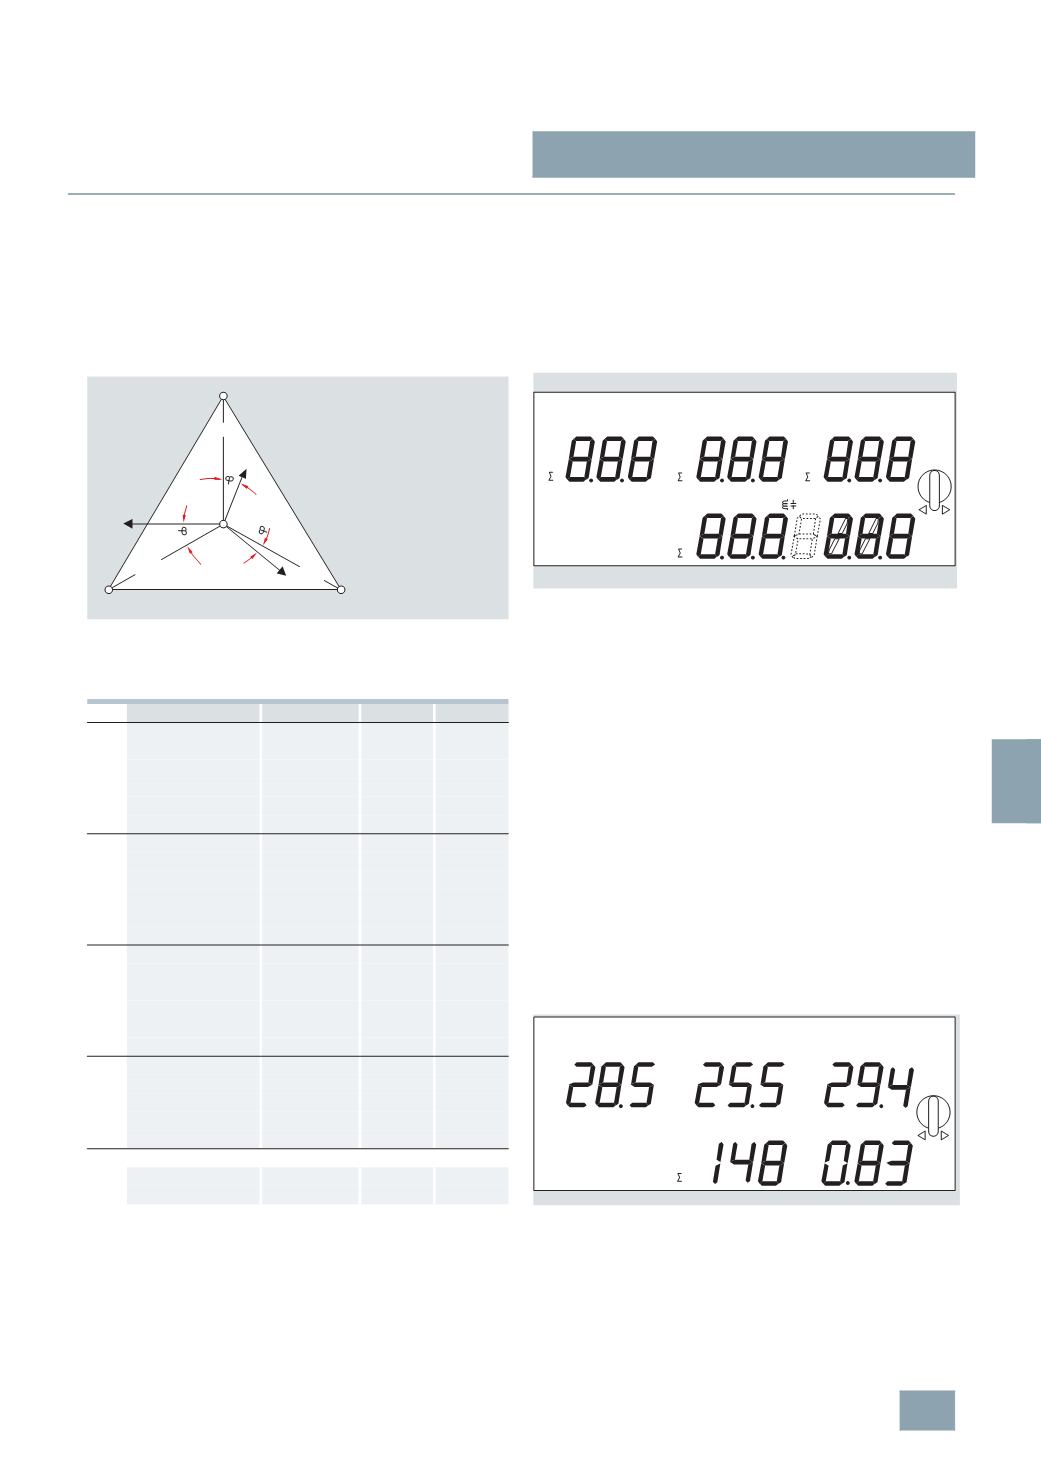
Voltage measurement
The multimeter measures the delta voltages L1 against L2; L2
against L3 and L3 against L1 or the star voltages L1, L2, L3
against N.
L symbol for the 3-phase system
This indicates that all physical units shown under this symbol are
always 3 phase.
Readout data
You can continuously display 5 measured quantities from the fol-
lowing 23 options.
Display
The multimeters have a covered, brightly lit LED display.
The measured values are indicated on an 11 mm high, green,
7-
segment LED, the physical units are indicated by orange text
abbreviations. Both colors are easier to recognize than the red
LEDs used for conventional displays. Capacitive loads are
automatically indicated by a capacitor symbol, inductive loads
by a coil symbol – also in orange.
Matrix selection
Conventional measuring instruments display voltages, currents,
powers, etc. in a rigid sequence on several "screens".
These multimeters allow users to define their own standard for
measured quantities per display field, so that they can be
implemented far more universally and flexibly.
A special feature is the analysis of the different loads on the
phases. Phase displacement and unsymmetrical or unbalanced
loads can cause partial overloads. These multimeters offer a
range of different options for combining and assessing measured
values.
The display fields are selected using rotary pushbuttons and the
desired indications confirmed with OK. By making the horizontal
selection e.g. W, V, A or p.f., and the vertical selection, e.g. L1,
L1 – L2 or
L, users can then define the desired measured
quantities for this display field.
The vertical data on the display can be assigned to any measured
value in the horizontal data. The letters M(ega) and k(ilo) are
automatically assigned according to measuring range, i.e.
measured value, e.g. kW or MW. Capacitive loads are
automatically indicated by a capacitor, inductive loads by a coil.
The following diagram shows an example of what your matrix
selection might look like.
No. Measured value
Display
Unit
Assignment
1
Active power
D1
W
L1
2
Voltage
D1
V
L1
3
Current
D1
A
L1
4
Apparent power
D1
VA
L1
5
p.f.
D1
p.f.
L1
6
Voltage
D1
V
L1 – L2
7
Active power
D2
W
L2
8
Voltage
D2
V
L2
9
Current
D2
A
L2
10
Apparent power
D2
VA
L2
11
p.f.
D2
p.f.
L2
12
Voltage
D2
V
L2 – L3
13
Active power
D3
W
L3
14
Voltage
D3
V
L3
15
Current
D3
A
L3
16
Apparent power
D3
VA
L3
17
p.f.
D3
p.f.
L3
18
Voltage
D3
V
L3 – L1
19
Active power
D1, D2, D3, D5 W
L
20
Apparent power
D1, D2, D3, D5 VA
L
21
Reactive power
D5
var
L
22
Frequency
D4
Hz
L
23
p.f.
D1, D2, D3, D4 p.f.
L
2
set values are also indicated:
24
Transformer setting D5
CT/A
/5
25
Transformer setting
CT/A
5 ... 5000
l1
L1-N
L1-L2
L1
L2
L3
L3-L1
l2
l3
L3-N
L2-N
N
L2-L3
I2_08410b
1
2
3
I2_11614a
OK
M kWVA
M kWVA
M kWVA
L
L1
D1
D2
D3
D5
D4
L1-2
L
L2
L2-3
L
L3
L3-1
L
M kWVAR
CT/A
H Z
p. f.
p. f.
p. f.
p. f.
I2_10803a
L1
kW
A
L2
L3
OK
kW
kW
L
p. f.
© Siemens AG 2008